Set up monitoring, alerts, and dashboards to track webhook delivery health, processing metrics, and system reliability.
Prop
Type
Description
delivery_success_ratepercentagePercentage of successful deliveries (2xx responses). Target: >99%
delivery_latencyduration (ms)Time from event trigger to successful delivery. Target: <5s p95
retry_ratepercentagePercentage of deliveries requiring retries. Target: <5%
timeout_ratepercentagePercentage of deliveries that timeout. Target: <1%
Prop
Type
Description
processing_durationduration (ms)Time to process webhook payload. Target: <2s p95
queue_depthcountNumber of webhooks waiting to be processed. Target: <100
processing_errorscountNumber of processing failures. Target: <10/hour
dlq_sizecountNumber of events in dead letter queue. Target: 0
Prop
Type
Description
events_per_minute?rateVolume of webhook events received. Monitor for anomalies
events_by_type?distributionBreakdown by event name. Identify patterns
unique_work_orders?countDistinct work orders receiving events. Track coverage
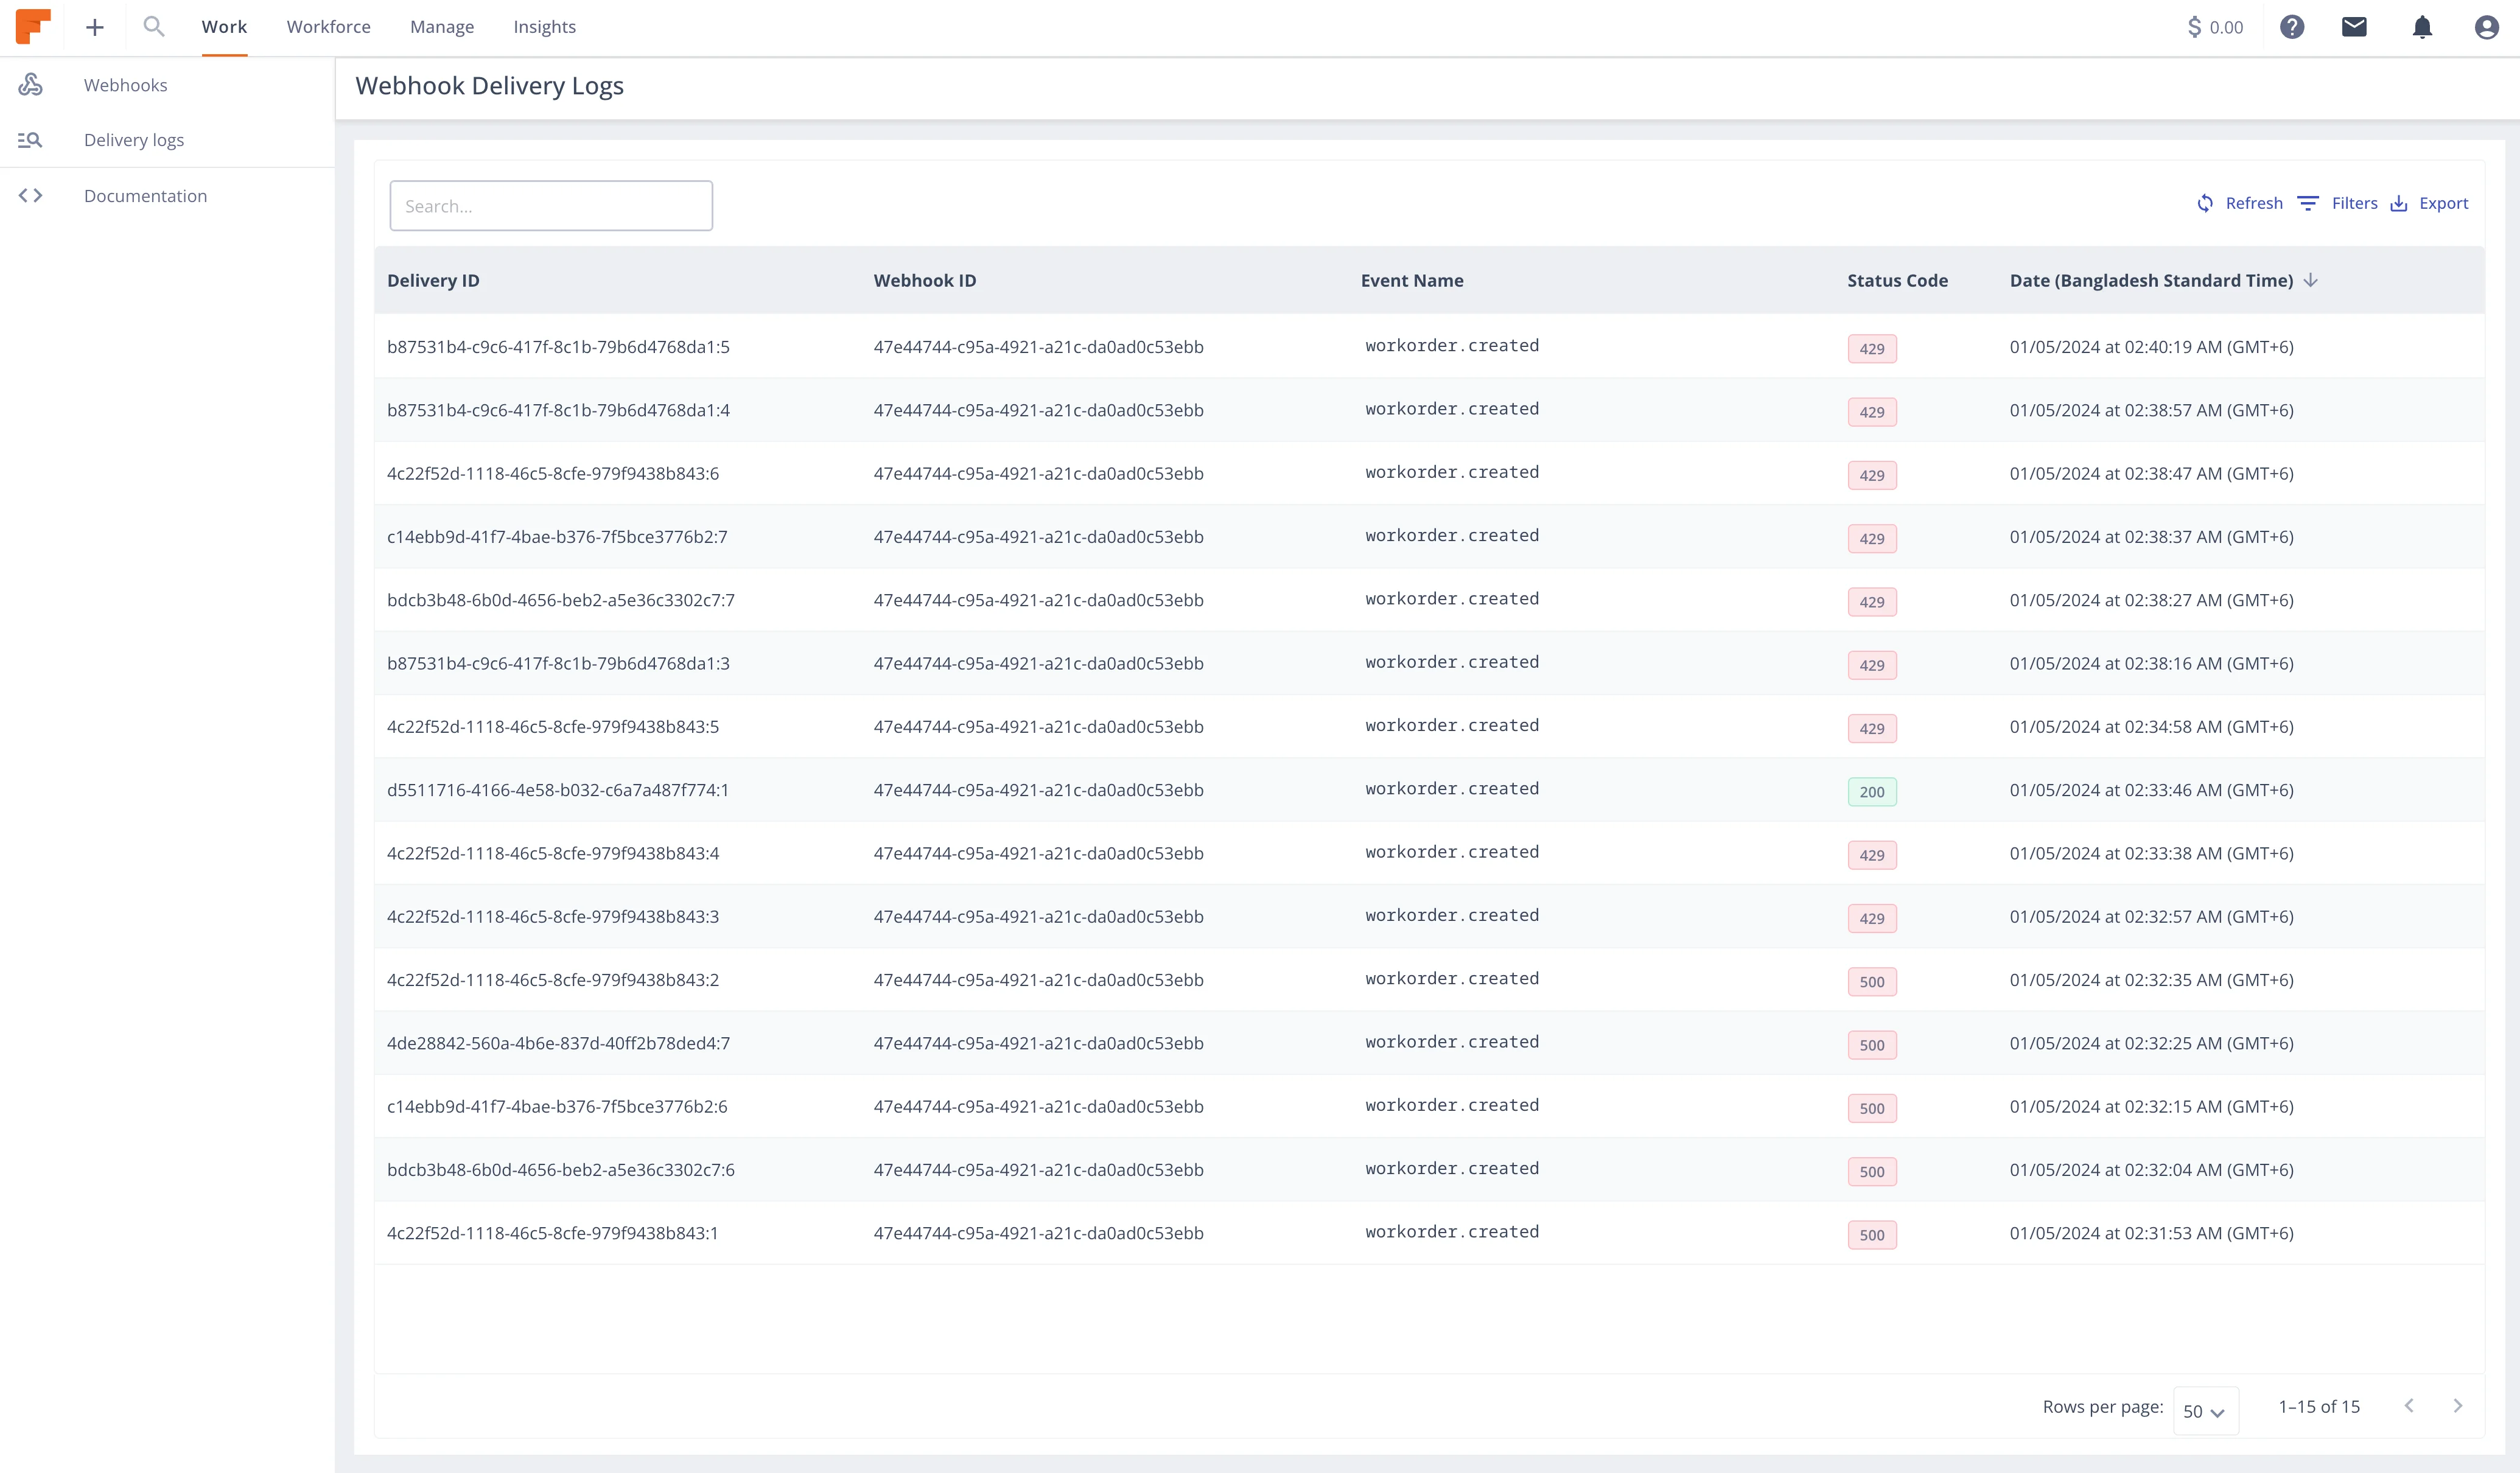
Access comprehensive delivery data via Field Nation's API:
curl -X GET "https://api-sandbox.fndev.net/api/v1/webhooks/delivery-logs?webhookId=wh_abc123&page=1&perPage=50" \
  -H "Authorization: Bearer YOUR_ACCESS_TOKEN"
Response:
{
  "metadata": {
    "timestamp": "2026-01-15T12:00:00Z",
    "count": 50,
    "total": 1234
  },
  "result": [
    {
      "deliveryId": "del_xyz789",
      "webhookId": "wh_abc123",
      "workOrderId": 12345,
      "eventName": "workorder.status.published",
      "deliveryStatus": 200,
      "deliveryAttempt": 1,
      "createdAt": "2026-01-15T11:59:00Z"
    }
    // ... more deliveries
  ]
}# Failed deliveries only
curl -X GET "https://api-sandbox.fndev.net/api/v1/webhooks/delivery-logs?webhookId=wh_abc123&deliveryStatus=500" \
-H "Authorization: Bearer YOUR_ACCESS_TOKEN"
# Retried deliveries
curl -X GET "https://api-sandbox.fndev.net/api/v1/webhooks/delivery-logs?webhookId=wh_abc123&sortBy=deliveryAttempt&sortDirection=DESC" \
-H "Authorization: Bearer YOUR_ACCESS_TOKEN"curl -X GET https://api-sandbox.fndev.net/api/v1/webhooks/delivery-logs/del_xyz789 \
-H "Authorization: Bearer YOUR_ACCESS_TOKEN"Response includes pre-signed URL to full log file:
{
  "metadata": {
    "timestamp": "2026-01-15T12:00:00Z"
  },
  "result": {
    "deliveryId": "del_xyz789",
    "webhookId": "wh_abc123",
    "eventName": "workorder.status.published",
    "deliveryStatus": 200,
    "deliveryAttempt": 1,
    "createdAt": "2026-01-15T11:59:00Z",
    "delivery_log": "https://s3.amazonaws.com/fn-logs/del_xyz789?expires=..."
  }
}
Poll delivery logs and alert on issues:
const fetch = require('node-fetch');

class WebhookMonitor {
  constructor(accessToken) {
    this.accessToken = accessToken;
    this.baseUrl = 'https://api-sandbox.fndev.net';
  }

  async getDeliveryLogs(webhookId, filters = {}) {
    const params = new URLSearchParams({
      webhookId,
      perPage: 100,
      ...filters
    });

    const response = await fetch(
      `${this.baseUrl}/api/v1/webhooks/delivery-logs?${params}`,
      {
        headers: { 'Authorization': `Bearer ${this.accessToken}` }
      }
    );

    return await response.json();
  }

  async calculateSuccessRate(webhookId, minutes = 60) {
    const sinceTime = new Date(Date.now() - minutes * 60 * 1000).toISOString();

    const logs = await this.getDeliveryLogs(webhookId, {
      sortBy: 'createdAt',
      sortDirection: 'DESC'
    });

    // Filter to time window
    const recentLogs = logs.result.filter(log =>
      new Date(log.createdAt) >= new Date(sinceTime)
    );

    if (recentLogs.length === 0) return 100;

    const successful = recentLogs.filter(log =>
      log.deliveryStatus >= 200 && log.deliveryStatus < 300
    ).length;

    return (successful / recentLogs.length) * 100;
  }

  async getRetryRate(webhookId, minutes = 60) {
    const sinceTime = new Date(Date.now() - minutes * 60 * 1000).toISOString();

    const logs = await this.getDeliveryLogs(webhookId);

    const recentLogs = logs.result.filter(log =>
      new Date(log.createdAt) >= new Date(sinceTime)
    );

    if (recentLogs.length === 0) return 0;

    const retried = recentLogs.filter(log =>
      log.deliveryAttempt > 1
    ).length;

    return (retried / recentLogs.length) * 100;
  }

  async checkHealth(webhookId) {
    const successRate = await this.calculateSuccessRate(webhookId, 60);
    const retryRate = await this.getRetryRate(webhookId, 60);

    const health = {
      webhookId,
      successRate,
      retryRate,
      status: 'healthy',
      issues: []
    };

    // Check success rate
    if (successRate < 95) {
      health.status = 'degraded';
      health.issues.push({
        type: 'low_success_rate',
        severity: successRate < 90 ? 'critical' : 'warning',
        message: `Success rate ${successRate.toFixed(2)}% is below threshold`
      });
    }

    // Check retry rate
    if (retryRate > 10) {
      health.status = 'degraded';
      health.issues.push({
        type: 'high_retry_rate',
        severity: retryRate > 20 ? 'critical' : 'warning',
        message: `Retry rate ${retryRate.toFixed(2)}% is above threshold`
      });
    }

    return health;
  }
}

// Usage
const monitor = new WebhookMonitor(process.env.FN_ACCESS_TOKEN);

async function runHealthCheck() {
  const webhookIds = ['wh_abc123', 'wh_def456'];

  for (const webhookId of webhookIds) {
    const health = await monitor.checkHealth(webhookId);

    console.log(`\nWebhook: ${webhookId}`);
    console.log(`Status: ${health.status}`);
    console.log(`Success Rate: ${health.successRate.toFixed(2)}%`);
    console.log(`Retry Rate: ${health.retryRate.toFixed(2)}%`);

    if (health.issues.length > 0) {
      console.log('Issues:');
      health.issues.forEach(issue => {
        console.log(`  - [${issue.severity}] ${issue.message}`);
      });

      // Send alerts
      await sendAlert(health);
    }
  }
}

// Run every 5 minutes
setInterval(runHealthCheck, 5 * 60 * 1000);Track your webhook processing metrics:
const prometheus = require('prom-client');

// Register default metrics
prometheus.collectDefaultMetrics();

// Webhook-specific metrics
const webhooksReceived = new prometheus.Counter({
  name: 'webhooks_received_total',
  help: 'Total webhooks received',
  labelNames: ['event_name', 'webhook_id']
});

const webhooksProcessed = new prometheus.Counter({
  name: 'webhooks_processed_total',
  help: 'Total webhooks processed',
  labelNames: ['event_name', 'status']
});

const webhookProcessingDuration = new prometheus.Histogram({
  name: 'webhook_processing_duration_seconds',
  help: 'Webhook processing duration',
  labelNames: ['event_name'],
  buckets: [0.1, 0.5, 1, 2, 5, 10, 30]
});

const webhookQueueSize = new prometheus.Gauge({
  name: 'webhook_queue_size',
  help: 'Number of webhooks in processing queue'
});

const webhookErrors = new prometheus.Counter({
  name: 'webhook_errors_total',
  help: 'Total webhook processing errors',
  labelNames: ['event_name', 'error_type']
});

// Usage
app.post('/webhooks/fieldnation', async (req, res) => {
  const payload = JSON.parse(req.body.toString());

  webhooksReceived.inc({
    event_name: payload.eventName,
    webhook_id: req.headers['x-fn-webhook-id']
  });

  // Queue and process...
  res.status(200).send('OK');
});

// Metrics endpoint
app.get('/metrics', async (req, res) => {
  res.set('Content-Type', prometheus.register.contentType);
  res.end(await prometheus.register.metrics());
});Create a Grafana dashboard with these panels:
# Success rate over 5 minutes
sum(rate(webhooks_processed_total{status="success"}[5m]))
/
sum(rate(webhooks_processed_total[5m]))
* 100

# Alert if < 95%
# p95 processing latency
histogram_quantile(0.95,
sum(rate(webhook_processing_duration_seconds_bucket[5m])) by (le)
)
# Alert if > 5 seconds# Errors per minute
sum(rate(webhook_errors_total[1m])) by (error_type)
# Alert if > 10/minute# Current queue size
webhook_queue_size
# Alert if > 1000Set up alerts for critical conditions:
- alert: WebhookSuccessRateLow
  expr: |
    sum(rate(webhooks_processed_total{status="success"}[5m]))
    /
    sum(rate(webhooks_processed_total[5m]))
    < 0.95
  for: 5m
  labels:
    severity: warning
  annotations:
    summary: "Webhook success rate below 95%"
    description: "Success rate is {{ $value | humanizePercentage }} over the last 5 minutes"

- alert: WebhookSuccessRateCritical
  expr: |
    sum(rate(webhooks_processed_total{status="success"}[5m]))
    /
    sum(rate(webhooks_processed_total[5m]))
    < 0.90
  for: 2m
  labels:
    severity: critical
  annotations:
    summary: "Webhook success rate below 90%"
    description: "CRITICAL: Success rate is {{ $value | humanizePercentage }}"
- alert: WebhookHighRetryRate
expr: |
sum(rate(webhooks_processed_total{status="retry"}[10m]))
/
sum(rate(webhooks_processed_total[10m]))
> 0.10
for: 10m
labels:
severity: warning
annotations:
summary: "High webhook retry rate"
description: "{{ $value | humanizePercentage }} of webhooks require retries"- alert: WebhookQueueBuildup
expr: webhook_queue_size > 1000
for: 5m
labels:
severity: warning
annotations:
summary: "Webhook queue size growing"
description: "Queue has {{ $value }} pending webhooks"
- alert: WebhookQueueCritical
expr: webhook_queue_size > 5000
for: 2m
labels:
severity: critical
annotations:
summary: "Webhook queue critically large"
description: "CRITICAL: Queue has {{ $value }} pending webhooks"- alert: WebhookProcessingErrors
expr: sum(rate(webhook_errors_total[5m])) > 10
for: 5m
labels:
severity: warning
annotations:
summary: "High webhook processing error rate"
description: "{{ $value }} errors per minute"# alertmanager.yml
route:
receiver: 'webhook-team'
group_by: ['alertname', 'severity']
group_wait: 30s
group_interval: 5m
repeat_interval: 4h
routes:
- match:
severity: critical
receiver: 'pagerduty'
- match:
severity: warning
receiver: 'slack'
receivers:
- name: 'webhook-team'
email_configs:
- to: 'webhooks-team@example.com'
- name: 'pagerduty'
pagerduty_configs:
- service_key: '<pagerduty_key>'
- name: 'slack'
slack_configs:
- api_url: '<slack_webhook_url>'
channel: '#webhooks-alerts'const winston = require('winston');
const logger = winston.createLogger({
level: 'info',
format: winston.format.combine(
winston.format.timestamp(),
winston.format.json()
),
defaultMeta: { service: 'webhook-processor' },
transports: [
new winston.transports.File({ filename: 'error.log', level: 'error' }),
new winston.transports.File({ filename: 'combined.log' })
]
});
// Log webhook receipt
logger.info('Webhook received', {
eventId: payload.eventId,
eventName: payload.eventName,
workOrderId: payload.workOrderId,
webhookId: req.headers['x-fn-webhook-id'],
deliveryId: req.headers['x-fn-delivery-id']
});
// Log processing success
logger.info('Webhook processed', {
eventId: payload.eventId,
duration: processingTime,
status: 'success'
});
// Log errors with context
logger.error('Webhook processing failed', {
eventId: payload.eventId,
eventName: payload.eventName,
error: error.message,
stack: error.stack,
retryable: isRetriable(error)
});Use tools like ELK Stack, Datadog, or CloudWatch:
// CloudWatch Logs
const AWS = require('aws-sdk');
const cloudwatchlogs = new AWS.CloudWatchLogs();

async function logToCloudWatch(logGroupName, logStreamName, message) {
  await cloudwatchlogs.putLogEvents({
    logGroupName,
    logStreamName,
    logEvents: [{
      message: JSON.stringify(message),
      timestamp: Date.now()
    }]
  }).promise();
}const express = require('express');
const app = express();
app.get('/health', async (req, res) => {
const health = {
status: 'healthy',
timestamp: new Date().toISOString(),
checks: {
webhookEndpoint: await checkEndpoint(),
queueHealth: await checkQueue(),
deliveryLogs: await checkDeliveryLogs(),
downstream: await checkDownstreamServices()
}
};
// Determine overall status
const hasErrors = Object.values(health.checks).some(check => !check.healthy);
health.status = hasErrors ? 'unhealthy' : 'healthy';
res.status(hasErrors ? 503 : 200).json(health);
});
async function checkEndpoint() {
try {
// Check if endpoint is responsive
const response = await fetch('https://your-endpoint.com/health');
return {
healthy: response.ok,
latency: response.headers.get('x-response-time')
};
} catch (error) {
return { healthy: false, error: error.message };
}
}
async function checkQueue() {
const queueSize = await getQueueSize();
return {
healthy: queueSize < 1000,
queueSize,
threshold: 1000
};
}
async function checkDeliveryLogs() {
const monitor = new WebhookMonitor(process.env.FN_ACCESS_TOKEN);
const successRate = await monitor.calculateSuccessRate('wh_abc123', 60);
return {
healthy: successRate > 95,
successRate,
threshold: 95
};
}
async function checkDownstreamServices() {
// Check Salesforce, database, etc.
return { healthy: true };
}
app.listen(3001);// Log incoming webhook details
app.post('/webhooks/fieldnation/debug', express.raw({ type: 'application/json' }), (req, res) => {
const debug = {
timestamp: new Date().toISOString(),
method: req.method,
url: req.url,
headers: req.headers,
body: req.body.toString(),
signature: req.headers['x-fn-signature'],
webhookId: req.headers['x-fn-webhook-id'],
eventName: req.headers['x-fn-event-name'],
deliveryId: req.headers['x-fn-delivery-id']
};
console.log('=== WEBHOOK DEBUG ===');
console.log(JSON.stringify(debug, null, 2));
res.status(200).send('OK');
});async function replayFailedEvents(webhookId, since) {
const logs = await getDeliveryLogs(webhookId, {
deliveryStatus: '500',
sortBy: 'createdAt',
sortDirection: 'DESC'
});
for (const log of logs.result) {
if (new Date(log.createdAt) < since) continue;
console.log(`Retrying delivery: ${log.deliveryId}`);
await fetch(
`https://api-sandbox.fndev.net/api/v1/webhooks/delivery-logs/${log.deliveryId}/retry`,
{
method: 'PATCH',
headers: { 'Authorization': `Bearer ${accessToken}` }
}
);
}
}Last updated on